Introduction
Kaggle’s famous (or infamous?) introductory data-science project is a heavy one – predicting the survival of each passenger on the Titanic based on a few personal characteristics and some details about their accommodations. In this article, I’m going to take an unusual angle on this project – looking at who aboard the Titanic got lucky.
Before getting into the question, there are a few critical details of the event that readers should be aware of. The RMS Titanic was a British passenger ship that sank on its maiden voyage on the morning of April 15, 1912. Of the approximately 2,224 passengers, over 1,500 died. This number isn’t surprising when you consider that there were only enough lifeboats for 1,178 people – perhaps due to both low safety standards and the arrogance of thinking the ship was “unsinkable.” As a result, the cultural norms of the day, such as “women and children first,” had a huge impact on who got into a lifeboat and who didn’t. That said, the presumption is that such things shouldn’t matter since the goal of the Kaggle competition isn’t for us humans to assume or guess the outcome, but rather to let objective machine-learning algorithms try to predict the fate of each passenger in an effort to learn the foundations of data science.
The Data and Analysis
When done correctly, a machine learning model should attempt to categorize each passenger as to whether they survived or didn’t. Given that this is a classification problem, a budding data scientist can choose from machine learning techniques like Naïve Bayes, Random Forests, Support Vector Machines, and others. As well, they can choose which features to feed into the model, including their age and sex, how much they paid for their ticket, how many family members were on board with them, and even what their names and titles were.

There are many great write-ups on how to pull apart the data and write Python code to get good prediction accuracy (80-90%) and then upload results to the Kaggle competition page to join the official leaderboard (for example, this one and this one). There are also many discussions about how some people “cheated” the challenge by using the names of the passengers – which are included in the dataset – against the official survivor/victim roster available on the internet, to then get a perfect prediction score (100%) without using any machine learning or any of the other data. I feel like cheating on a learning exercise should be considered in employment decisions, but I digress. The key point here is:
All this focus on accuracy makes sense, given that the competition result is focused on this score.
But are we missing something, as a result of this focus?
NOTE: there is minimal code included in this article. If you’d like to follow along, see my Titanic Github collection, and choose the Jupyter notebook file with the title matching this article.
Some Passengers Got Lucky; Others, Unlucky
In my learning journey, I set up 6 models and worked them to the bone trying to optimize each. As I worked through the challenge and couldn’t break above 84% accuracy, though, I got to the point where I considered using an ensemble of the algorithms to try to improve my score. My engineering brain told me that I should first get a theoretical maximum accuracy that I could attain before running the ensemble, to see if it would be worth the effort, by assuming that I could combine all 6 of the algorithms ‘perfectly.’

I wondered if I could identify the passengers whom each model predicted incorrectly, and then find the intersection of these passenger lists with various model combinations (e.g., which passengers did both KNN and Logistic Regression models get wrong?). Assumingly, if none of the 6 models could get them right, then an ensemble wouldn’t either, so this could determine the absolute best I could do. I threw together some code and parsed through all of the possible combinations of models. The results were very interesting, even showing that some combinations of fewer than the 6 algorithms did a great job. Looking at the best-case result, none of the models could get 79 of the 891 passengers correct in the training dataset. Therefore, I set my theoretical maximum score for an ensemble at 100% –79/891 = 100% – 8.9% = 91.1%.
Now, if you’ve ever run an ensemble, you know that this isn’t how it works, so I would never get that number. To get that number, each model would have to look at which predictions it got wrong and ask the next model to try to get those correct. With a training dataset in a supervised learning situation, I suppose that is possible since you have the correct labels. However, when running on test data to predict the class this doesn’t work, so this theoretical maximum is merely an academic exercise. I thought it important to note this for any readers who either think I don’t understand machine learning or who might be learning data science and believe that this is actually a practical solution.
Nonetheless, something dawned on me as I looked at the number of passengers whom none of the models got right:
These were the lucky and unlucky passengers of the Titanic disaster.
We know from stories of the event that social hierarchies and norms persisted throughout the disaster, even in the face of death. The wealthy (1st class), women and children, and accompanied (i.e. they were not alone) passengers of the Titanic had a high likelihood of survival. On the flip side, men, less-wealthy (2nd and 3rd class), and those who were alone had a much-lower likelihood of making it out alive. See the categorical percentages in the table below for more insight. If you’re unfamiliar with why this happened, read some stories like this one about how the life boats sadly were not loaded properly before lowering down into the water, leaving many people stranded unnecessarily, in addition to the insufficient life boat count.

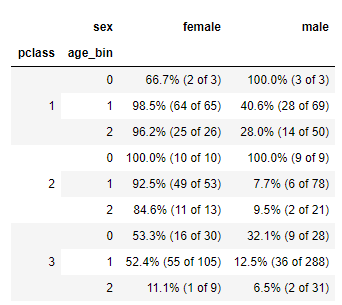
Looking at the table above, we could make some early guesses as to whether a passenger would survive simply by knowing 3 basic characteristics about them. We need machine learning models to do full predictions, though, because they are better equipped to handle the entire dataset. And again, for most people these models got about 80-90% of the passengers’ fates correct.
But in my modeling, 79 passengers’ fates were unpredictable. That is, to a significant degree, their survival wasn’t predictable from their sex, age, social status, location on the boat, or the like, despite giving 6 different algorithms a chance to get it right.
Instead, their fate was decided by luck.
Based on the stats, we might guess that the lucky ones are the men, less-wealthy, alone, and mid- and older-aged passengers who somehow made it to safety that day. And we might guess that the unlucky ones are probably women and children, wealthy, and accompanied passengers who should have survived but were in the wrong place at the wrong time.
Could it really be that simple? Let’s ask the data:

Wait, what does that say?! It looks like of the women who the models couldn’t predict correctly, none (0%) of them survived! And of the men who all of the models got wrong, all (100%) of them survived!
This could be interpreted in a few ways, but mainly it says that despite all of the data we gave the models, none of the models could overcome the sex-related anomalies. Just as social norms established, since it was “women and children first,” women were expected to survive and men were likely to perish. And when that wasn’t the case, the machine learning models had trouble and predicted incorrectly, even with all of the other info about their wealth, age, family on the boat, and journey details to help decide.
This shows the immense power of culture and social norms. That is, it wouldn’t be surprising for a human being to get hung up in these norms and guess passengers’ fates wrong, but for a computer algorithm to have the same problem shows that it was so pervasive on the Titanic that fateful morning that even math couldn’t get around it.
Maybe some stories from those in the list of 79 passengers can help illuminate what we’re seeing.
Stories of the Lucky and Unlucky
I took the list of 79 passengers who the models couldn’t accurately predict and searched the web for their stories. Many had no information, or the accounts weren’t detailed enough to learn from. I selected the 4 people below – 2 male and 2 female – because their stories gave great insight into how they escaped the predictive power of machine learning.

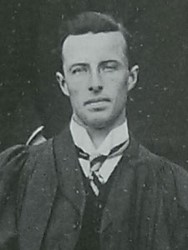
Mr. Lawrence Beesley took a break from teaching science and boarded the Titanic with a 2nd class ticket. When the ship first struck the iceberg, Lawrence noticed and went to investigate but was told things were fine. Having doubts, he headed to the deck of the Titanic and was shocked yet lucky to find lifeboats being loaded. Lawrence approached one lifeboat, with only enough space left for one person, and the crew called out for any women or children to be loaded. Finding none, they invited Lawrence, saving his life by this cascade of lucky breaks.
Source: https://www.encyclopedia-titanica.org/
Source: https://www.encyclopedia-titanica.org/
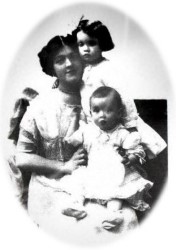
Mrs. Bess Allison boarded the Titanic with her husband and their young son and infant daughter. When the collision occurred, her husband took their son and boarded a lifeboat to safety. Bess and her daughter boarded another lifeboat but didn’t know her husband and son had made it to safety. Unable to leave them, she took her daughter, left the lifeboat, and returned to the ship deck to search. After failing to find her departed husband and son, the mother and daughter pair took to a collapsible lifeboat at the last moment but sadly toppled out into the freezing water, leading to their demise.
Mr. Masabumi Hosono was the only Japanese person aboard the Titanic. He was awoken from his 2nd class cabin by banging on his door and exited into a chaotic scene. Desperate to see his wife and kids again, he pleaded to join a lifeboat with 2 open seats, but was turned away for being both a male and a foreigner. When the crewman turned his back, Masabumi took the opportunity to take the last seat as another man had just taken the other. He survived the tragedy, against all odds, only to be ridiculed by his countrymen for not going down with the ship, and subsequently lost his government job and became a source of family shame even after his death years later.
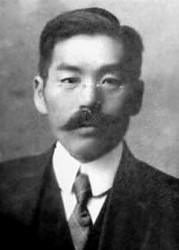
Source: https://www.encyclopedia-titanica.org/
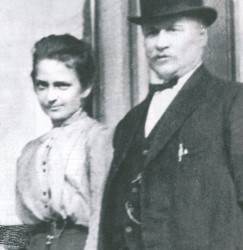
Source: https://www.findagrave.com
Mrs. Anna Amelia Lahtinen and her husband William were returning from Finland after a family visit and series of lectures that William had given. After the collision, they made it to the deck of the boat and found their family and friends, who boarded a lifeboat and urged Anna to join them. William, however, was not getting into a lifeboat and Anna, in her final act of love and loyalty, clung to him and rode the ship with him to her demise.
The pattern in these and other stories from that fateful morning is clear – the human element of culture. While computer algorithms can’t directly comprehend it, they surely detect the symptoms of it. And in the case of the Titanic, those who got lucky and unlucky were heavily affected by it.
Conclusion
This article was an exploration of something that we occasionally forget in data science. We get so focused on the accuracy of our modeling that we neglect to think about the model’s outliers. That’s good, in a way. By focusing on the most predictable outcomes, we make our efforts highly efficient. But if this is, for example, marketing that we’re talking about, we’ve missed out on a segment of the population that no one is advertising to.
That also happens to be me. It is extremely rare that an advertisement – be it on the web, on tv, or on the radio – actually speaks to me. I’m that outlier who no one tries to persuade. Surely, that’s fine by me – I appreciate the help with saving money! But for advertisers, that means missed revenue. Their ROI would likely be terrible if they tried to market to us outliers, however, as they would have to make specialized ads to reach me and still take a chance that I don’t buy. So, they tend not to do it.
On the other hand, in medicine, tens of thousands of people should be thankful for the doctors who looked closely at their rare “outlier” diseases, like Non-Hodgkin Lymphoma and Amyotrophic lateral sclerosis (ALS), to find treatments that can improve life and maybe someday even cures. When those who suffer from these rare diseases presented confusing and unpredictable symptoms that didn’t lead to an easy diagnosis, someone took the time to look at their case and see what was missed. Thanks to those efforts, these rare classes of people now have answers – and sometimes solutions – to their ailments.
Reflection and Application Questions
So ask yourself: what are my model outliers? Is there value in an analysis of them? In my context, is it worth investigating them or should I stay focused on the predictable data points?
